


How can your breath
know it all?
Every number in a neumafit report is grounded in science.
Here's how 10 minutes of breathing data becomes your own training prescription.
Read the breath,
and the metabolism appears.
The answer is in your breath. By measuring the oxygen (O₂) you inhale and the carbon dioxide (CO₂) you exhale in real time,
we can work out which fuel your body is burning right now.
Add heart-rate data, and those metabolic shifts map onto your own heart-rate zones (Z1–Z5).
It's the same principle as the CPET exercise test used in hospitals.
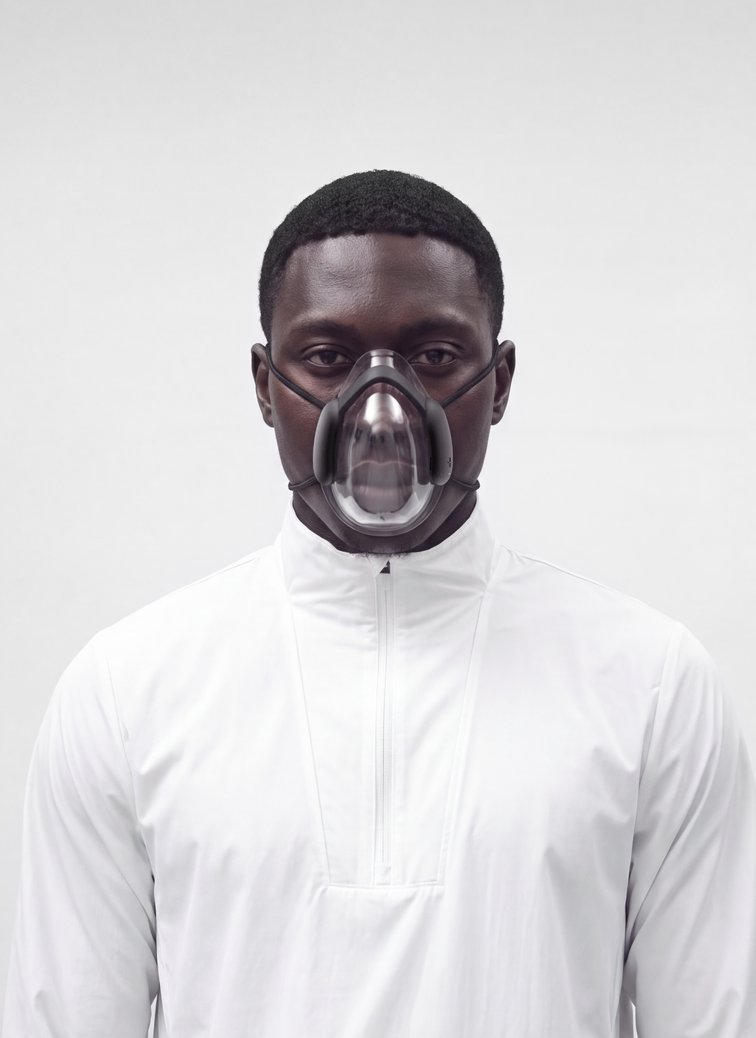
The mask captures every breath,
the monitor records the heart's rhythm.

What is RER?
It's your body's fuel gauge.
CO₂ output ÷ O₂ consumption. A lower ratio means you're burning fat; closer to 1.0 means carbohydrates.
Every metabolic metric in neumafit starts from this value.
Read the breath,
and the metabolism appears.
The answer is in your breath. By measuring the oxygen (O₂) you inhale and the carbon dioxide (CO₂) you exhale in real time, we can work out which fuel your body is burning right now.
Add heart-rate data, and those metabolic shifts map onto your own heart-rate zones (Z1–Z5). It's the same principle as the CPET exercise test used in hospitals.
The mask captures every breath,
the monitor records the heart's rhythm.
What is RER?
It's your body's fuel gauge. CO₂ output ÷ O₂ consumption. A lower ratio means you're burning fat; closer to 1.0 means carbohydrates. Every metabolic metric in neumafit starts from this value.
The heart of the report: two curves
A 10-minute test answers two questions about your body.
“What do you burn to run” is answered by the metabolic curve; “how far does the engine hold” by the cardiopulmonary curve. Both curves are drawn from a single set of breath data.
What do you burn to run?
Fat & carbohydrate metabolic curve
As speed rises, how much fat and carbohydrate your body burns is written directly in your breath. Connecting those values by speed draws the metabolic curve.


FATMAX
Find the intensity where your
body burns fat best.
142 bpm
7'20" /km
(approx. 8.2 km/h)


MFO
Find the maximum fat your body
can burn per minute.
35 g/h


Fat-Burning Ceiling
Past this intensity, you start
burning carbs instead of fat.
13.4 km/h

Fatmax
Find the intensity where your
body burns fat best.
142 bpm
7'20" /km
(approx. 8.2 km/h)


MFO
Find the maximum fat your body
can burn per minute.
35 g/h

Fat-Burning Ceiling
Past this intensity, you start
burning carbs instead of fat.
13.4 km/h
What this curve tells you
Fat-centered training builds your body's ‘fuel economy’.
A comfortable intensity that uses fat as the main fuel. Your aerobic base, fat loss, and endurance grow here. Slow jogging and LSD long runs live in this zone.
Carb-centered training builds your body's ‘peak output’.
A high intensity that uses carbohydrate as the main fuel. Speed and maximal cardiopulmonary capacity (VO₂max) grow here. Intervals and tempo runs live in this zone. Held too long it can bring a ‘bonk’ and fatigue, so keep it short and hard and recover fully.
Neither is good nor bad. It only shifts in ratio between the two zones depending on your goal — which is why knowing where your body's turning point lies is what matters.
How far can the engine hold?
The VO₂max cardio curve
Over the same 10 minutes, how much oxygen you used (VO₂) and how much CO₂ you exhaled (VCO₂) are recorded too. These two lines hold every marker of cardiopulmonary capacity.

VO2max
See the size and genetic
potential of your cardio engine.
47.4 ml/kg/min

Lactate Threshold
Find the limit you can hold
without breaking down.
6'15" /km
(approx. 9.6 km/h)

Running Economy
Hold the same pace with less effort —
see how efficient your aerobic engine is.
88 kcal/km

VO2max
See the size and genetic
potential of your cardio engine.
47.4 ml/kg/min

Lactate Threshold
Find the limit you can hold
without breaking down.
6'15" /km
(approx. 9.6 km/h)

Running Economy
Hold the same pace with less effort —
see how efficient your aerobic engine is.
88 kcal/km
What this curve tells you
Know the ceiling and your training goal comes into view.
VO₂max is the current size of your engine. Knowing where the ceiling sits tells you how far to push interval intensity and roughly where the upper bound of your records lies.
Know the limit line and your pace strategy comes into view.
The lactate-threshold pace is the ‘fastest speed you can sustain.’ Race pace, tempo-run intensity, and the safe line for long runs are all set from this line.
The ceiling and the limit line. Know these two coordinates and ‘how hard, how long’ is set by numbers rather than feel.
The heart of the report: two curves
A 10-minute test answers two questions about your body.
“What do you burn to run” is answered by the metabolic curve; “how far does the engine hold” by the cardiopulmonary curve.
Both curves are drawn from a single set of breath data.
What do you burn to run?
Fat & carbohydrate metabolic curve
As speed rises, how much fat and carbohydrate your body burns is written directly in your breath.
Connecting those values by speed draws the metabolic curve.
FATMAX
Find the intensity where your
body burns fat best.
142 bpm
7'20" /km
(approx. 8.2 km/h)
MFO
Find the maximum fat your body
can burn per minute.
35 g/h
Fat-Burning Ceiling
Past this intensity, you start
burning carbs instead of fat.
13.4 km/h
FATMAX
Find the intensity where your
body burns fat best.
142 bpm
7'20" /km
(approx. 8.2 km/h)
MFO
Find the maximum fat your body
can burn per minute.
35 g/h
Fat-Burning Ceiling
Past this intensity, you start
burning carbs instead of fat.
13.4 km/h
What this curve tells you
Fat-centered training builds your body's ‘fuel economy’.
A comfortable intensity that uses fat as the main fuel. Your aerobic base, fat loss, and endurance grow here. Slow jogging and LSD long runs live in this zone.
Carb-centered training builds your body's ‘peak output’.
A high intensity that uses carbohydrate as the main fuel. Speed and maximal cardiopulmonary capacity (VO₂max) grow here. Intervals and tempo runs live in this zone. Held too long it can bring a ‘bonk’ and fatigue, so keep it short and hard and recover fully.
Neither is good nor bad. It only shifts in ratio between the two zones depending on your goal — which is why knowing where your body's turning point lies is what matters.
How far can the engine hold?
The VO₂max cardio curve
Over the same 10 minutes, how much oxygen you used (VO₂) and how much CO₂ you exhaled (VCO₂) are recorded too.
These two lines hold every marker of cardiopulmonary capacity.
VO2max
See the size and genetic
potential of your cardio engine.
47.4 ml/kg/min
Lactate Threshold
Find the limit you can hold
without breaking down.
6'15" /km
(approx. 9.6 km/h)
Running Economy
Hold the same pace with less effort —
see how efficient your aerobic engine is.
88 kcal/km
VO2max
See the size and genetic
potential of your cardio engine.
47.4 ml/kg/min
Lactate Threshold
Find the limit you can hold
without breaking down.
6'15" /km
(approx. 9.6 km/h)
Running Economy
Hold the same pace with less effort —
see how efficient your aerobic engine is.
88 kcal/km
What this curve tells you
Know the ceiling and your training goal comes into view.
VO₂max is the current size of your engine. Knowing where the ceiling sits tells you how far to push interval intensity and roughly where the upper bound of your records lies.
Know the limit line and your pace strategy comes into view.
The lactate-threshold pace is the ‘fastest speed you can sustain.’ Race pace, tempo-run intensity, and the safe line for long runs are all set from this line.
The ceiling and the limit line. Know these two coordinates and ‘how hard, how long’ is set by numbers rather than feel.
It doesn't end at measurement.
From your data, neumafit builds a plan for this week — turning it into lasting training habits.
STEP 1
10-min test & personal HR zones
Metabolic, cardio and respiratory data in one test — your heart-rate zones from Zone 1 to Zone 5, from real data.
STEP 2
Workout prescription
Five running workouts matched to your goal. Slow jog · LSD long run · Tempo · Interval · Recovery jog
STEP 3
Weekly plan
Your prescriptions auto-arranged on a day-by-day calendar, for an effective, purpose-built training week.
STEP 4
Re-test & growth analysis
Re-test in 6–8 weeks to see your growth in numbers, with fresh solutions for what comes next.
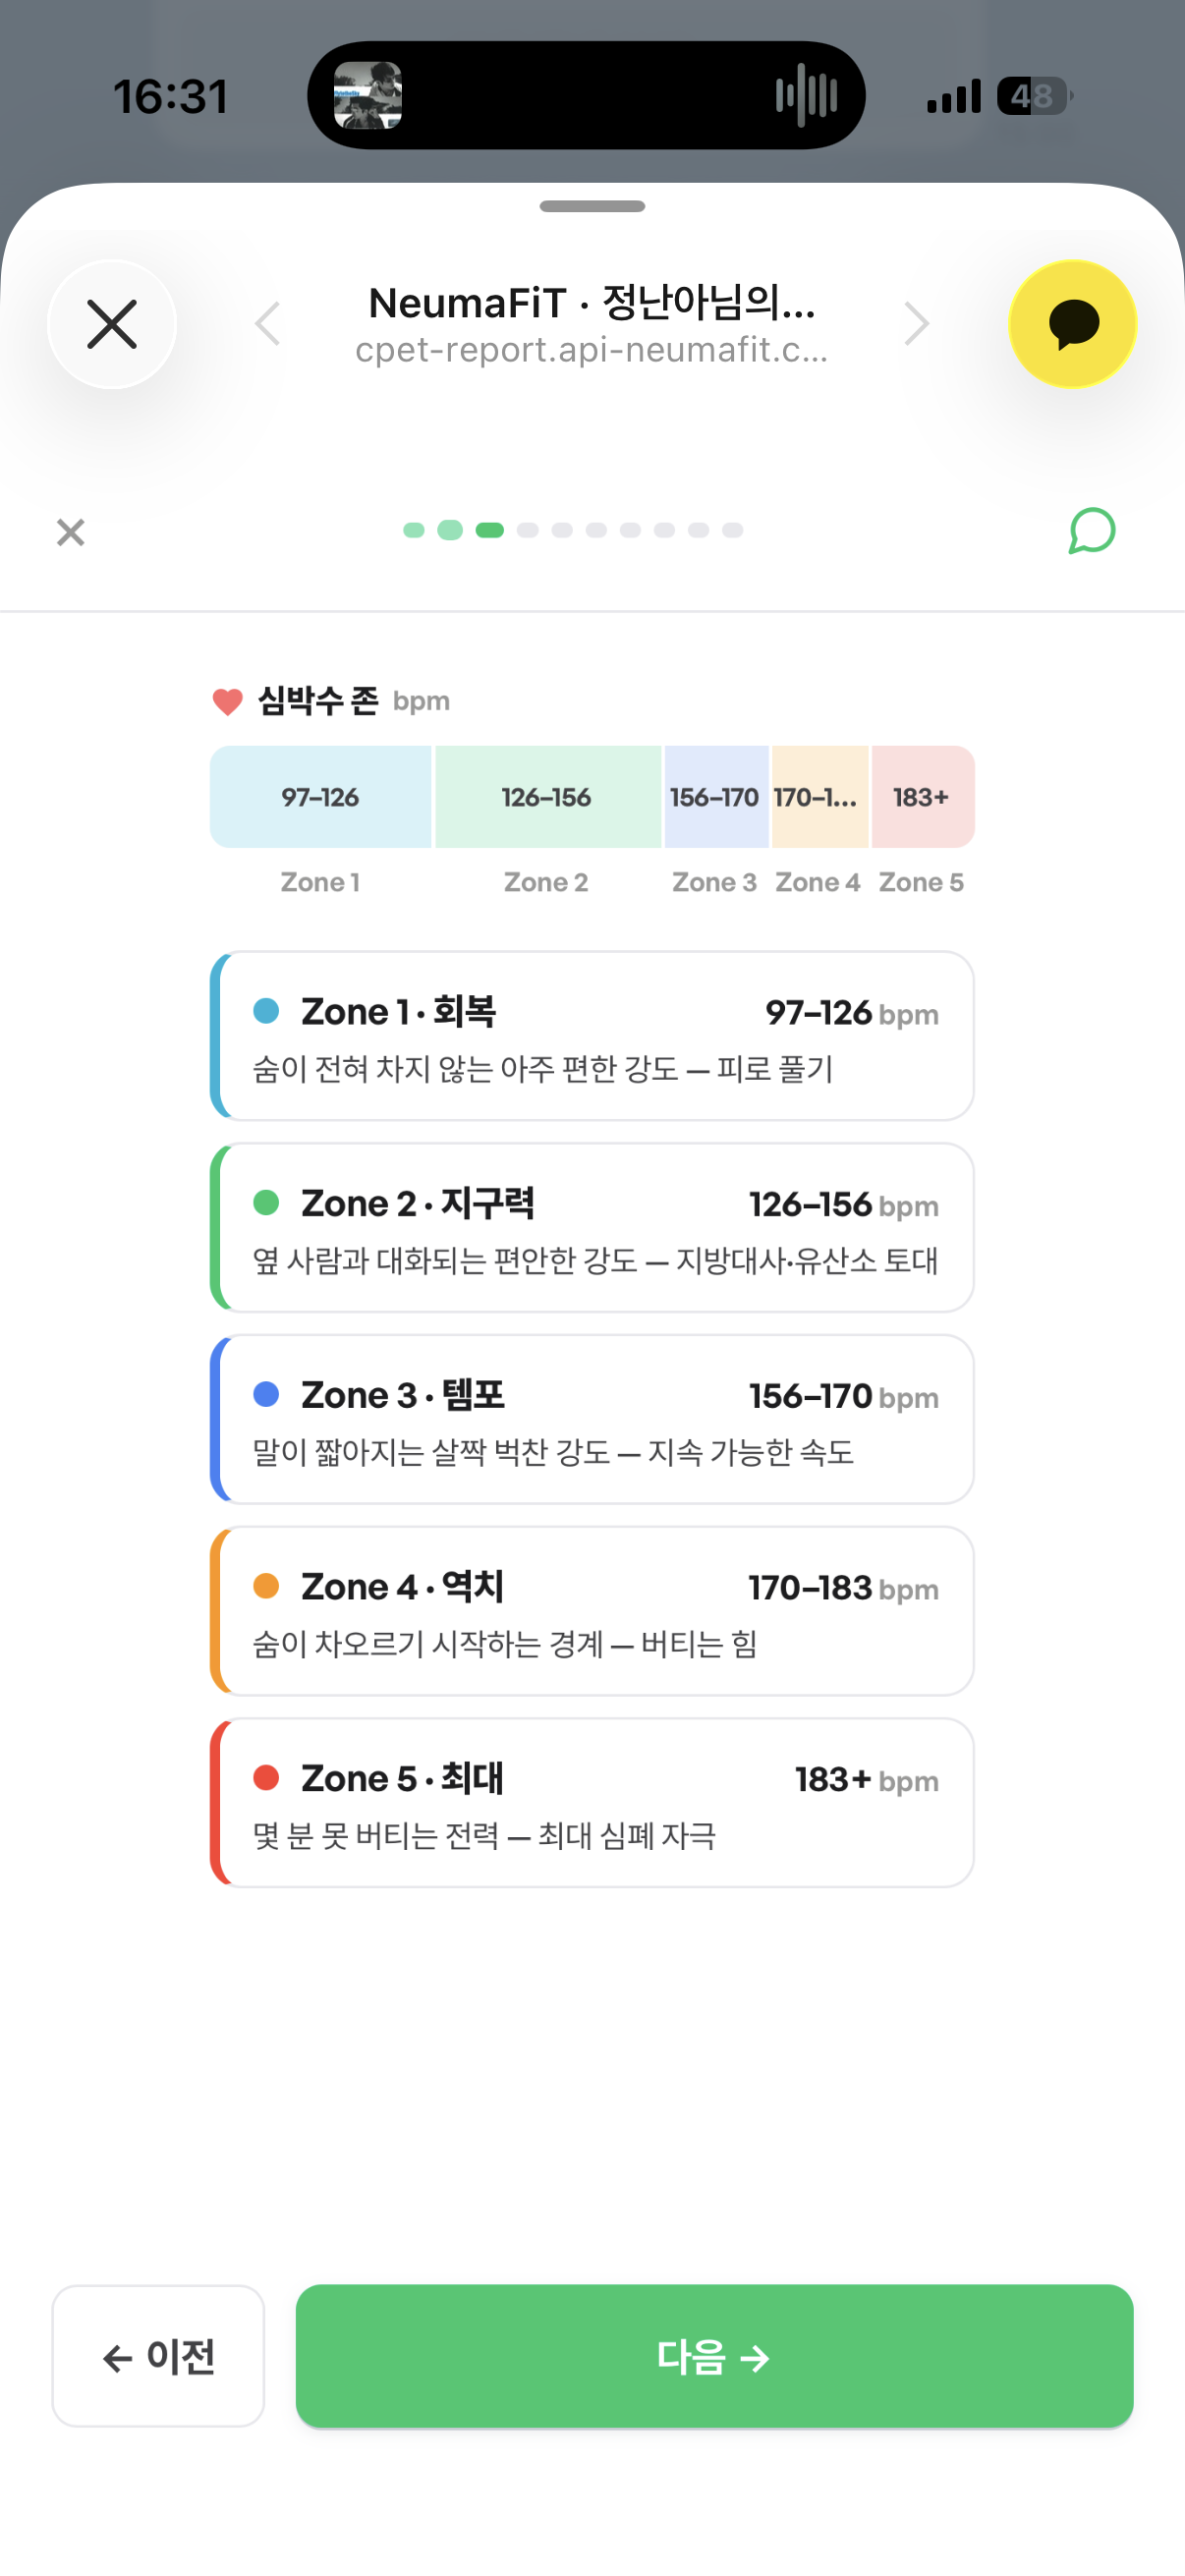
Your own intensity zones,
built from real data.
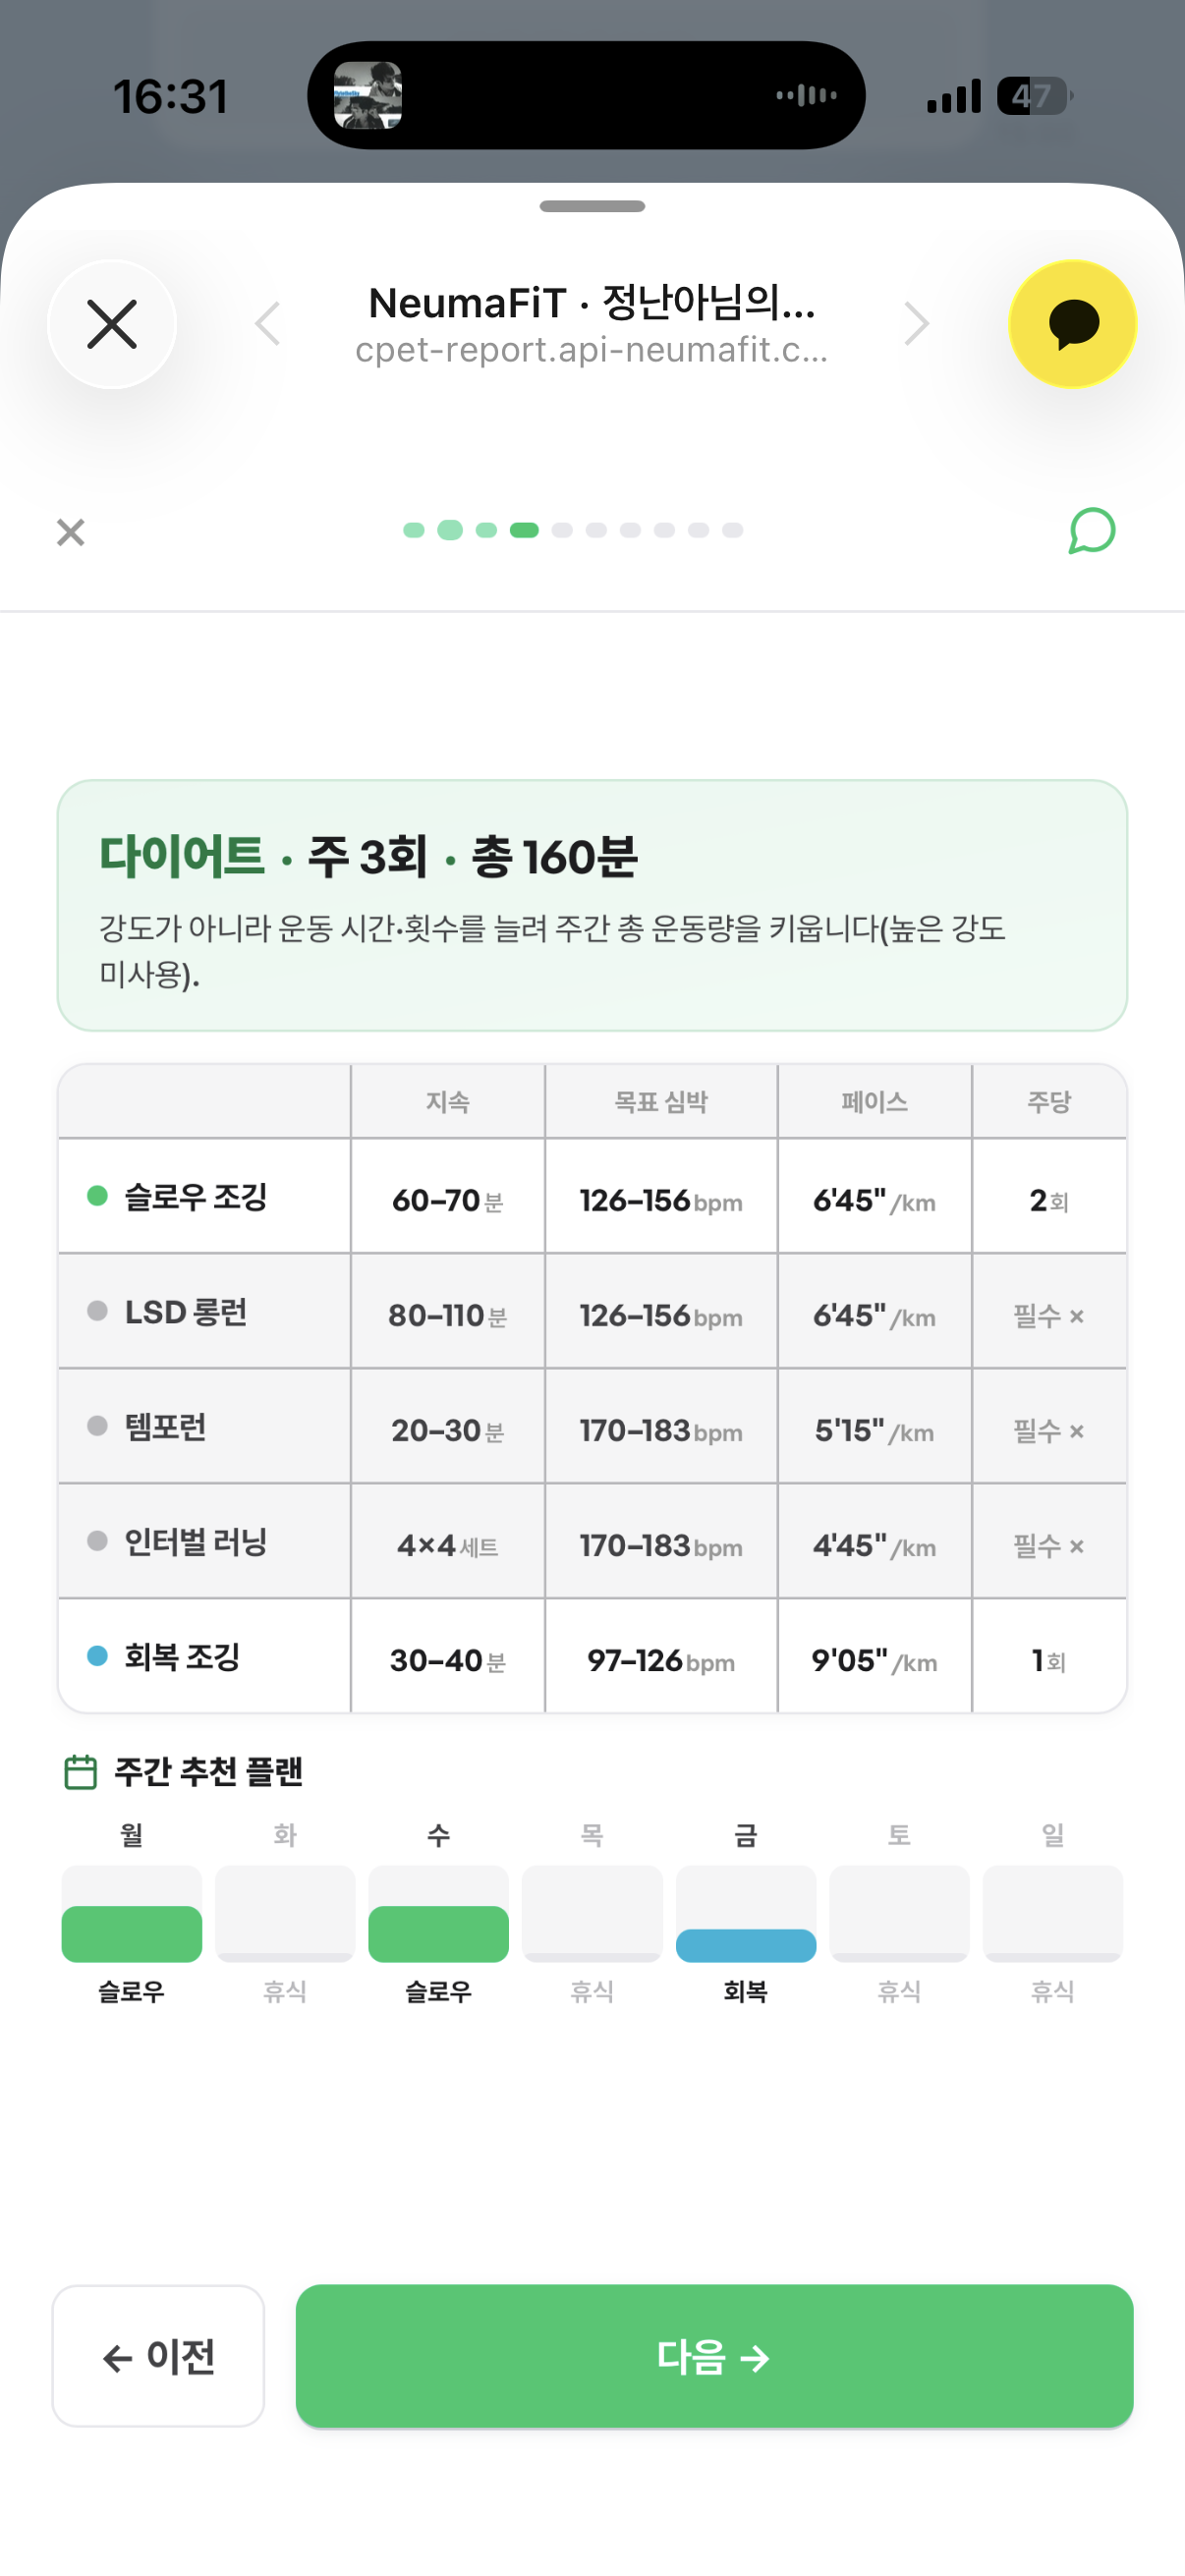
Pick a goal and frequency —
your week is set.
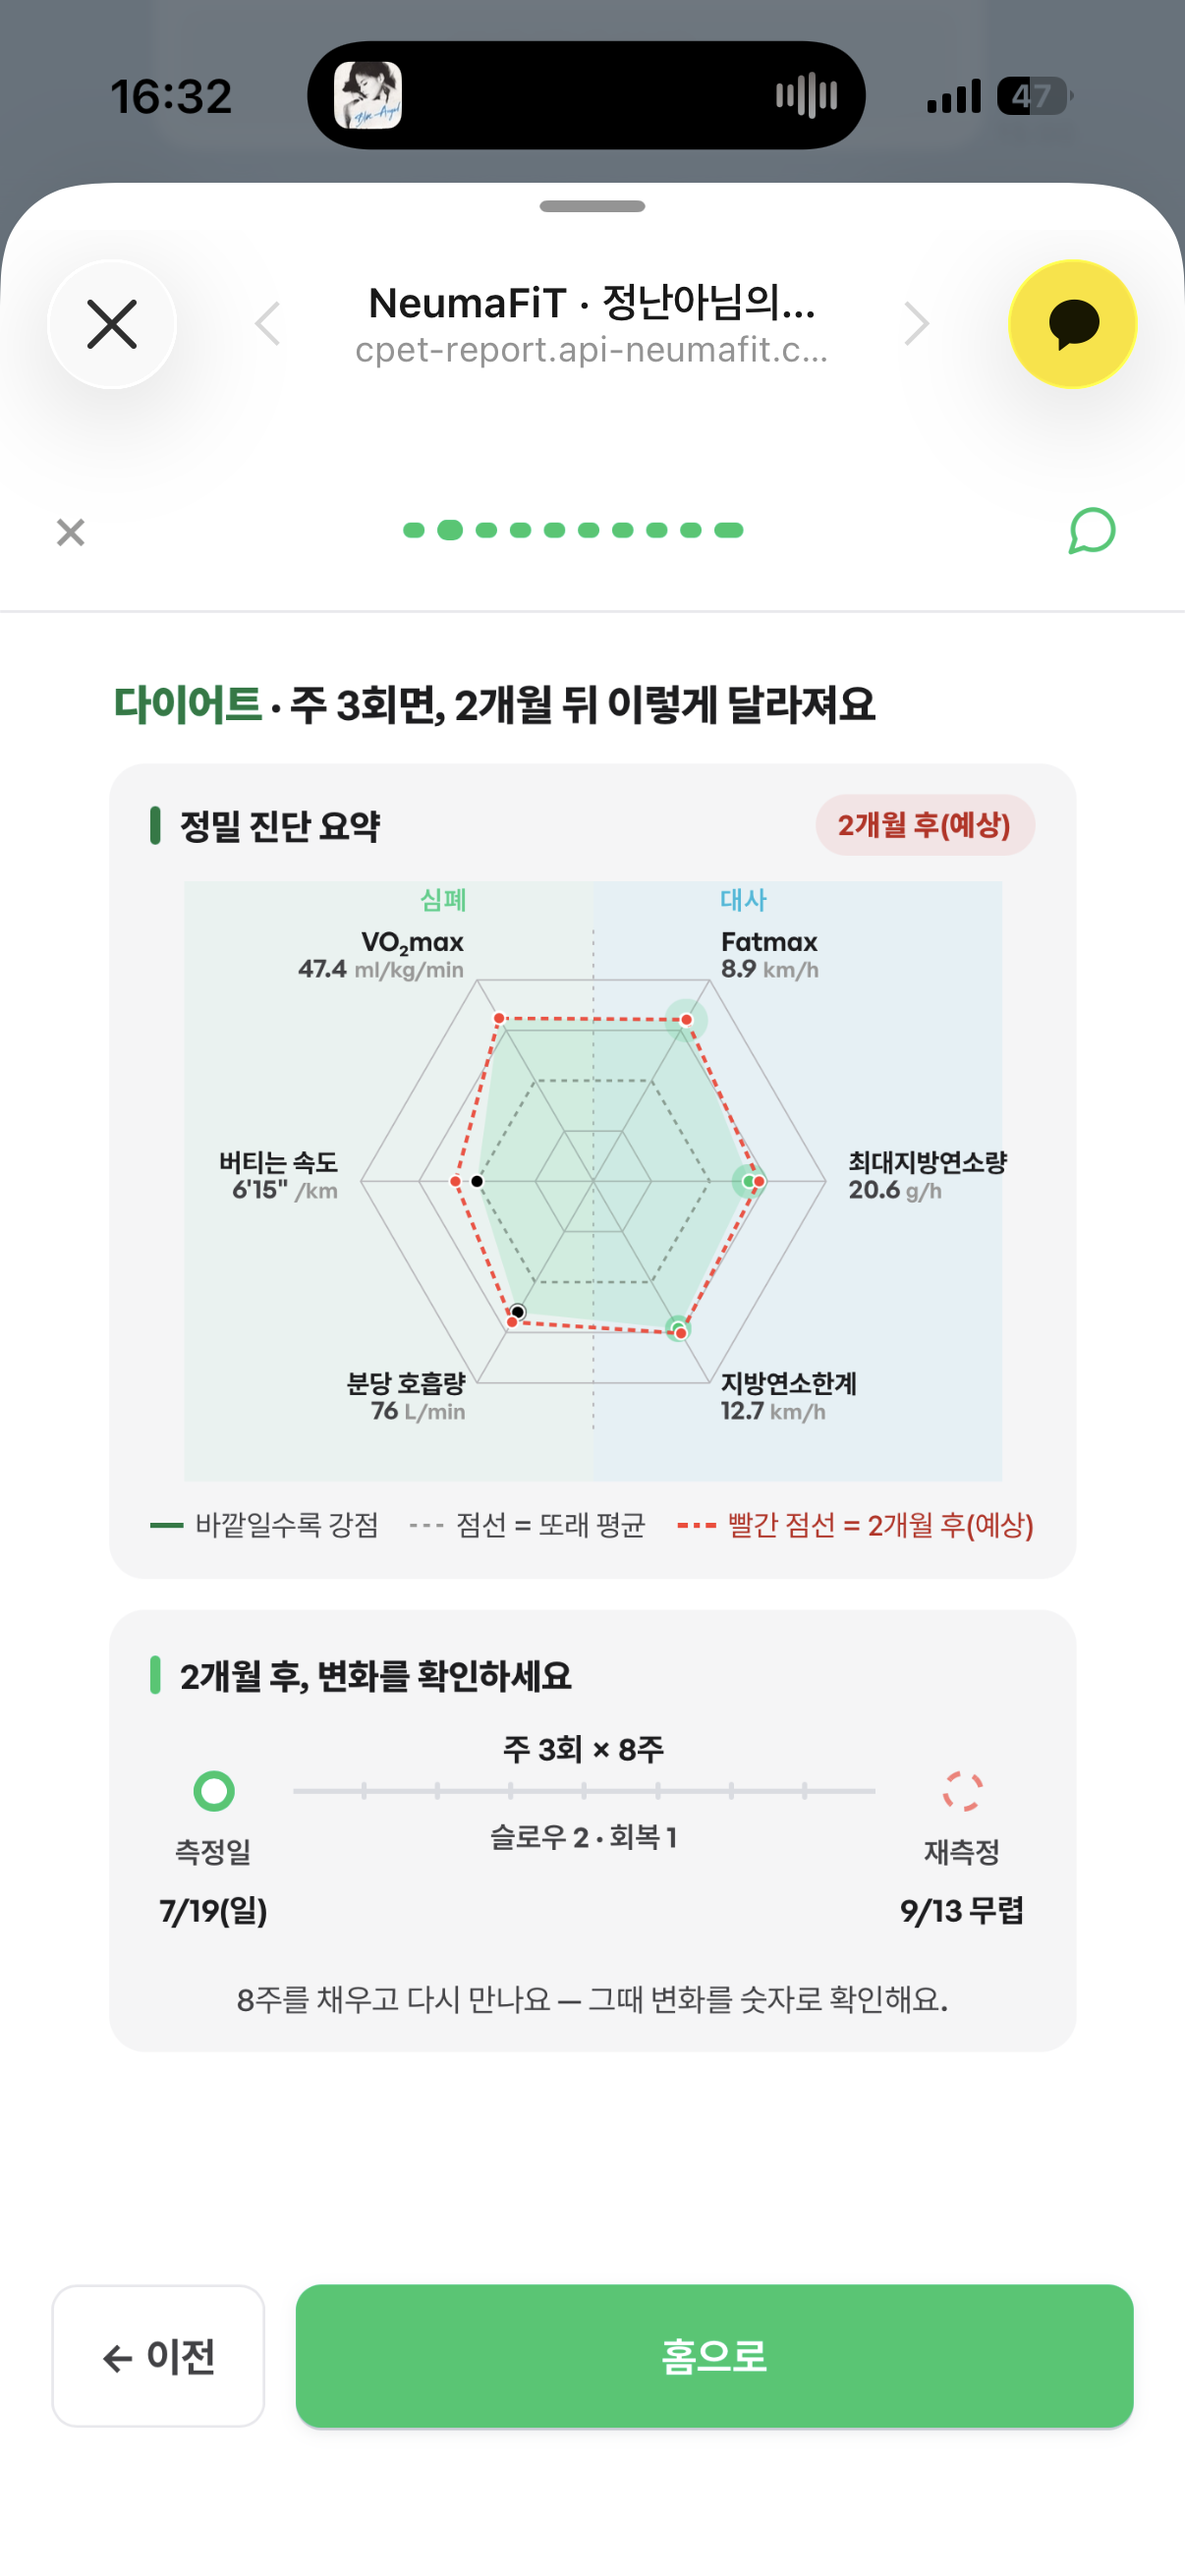
From today's condition
to your body's future growth.
Curious how a real report
is put together?

When growth shows in numbers, training keeps going.
It doesn't end at measurement.
From your data, neumafit builds a plan for this week — turning it into lasting training habits.
10-min test & personal HR zones
Metabolic, cardio and respiratory data in one test —
your heart-rate zones from Zone 1 to Zone 5, from real data.
Workout prescription
Five running workouts matched to your goal.
Slow jog · LSD long run · Tempo · Interval · Recovery jog
Weekly plan
Your prescriptions auto-arranged on a day-by-day calendar,
for an effective, purpose-built training week.
Re-test & growth analysis
Re-test in 6–8 weeks to see your growth in numbers,
with fresh solutions for what comes next.
Your own intensity zones,
built from real data.
Pick a goal and frequency —
your week is set.
From today's condition
to your body's future growth.
Curious how a real report is put together?
When growth shows in numbers, training keeps going.
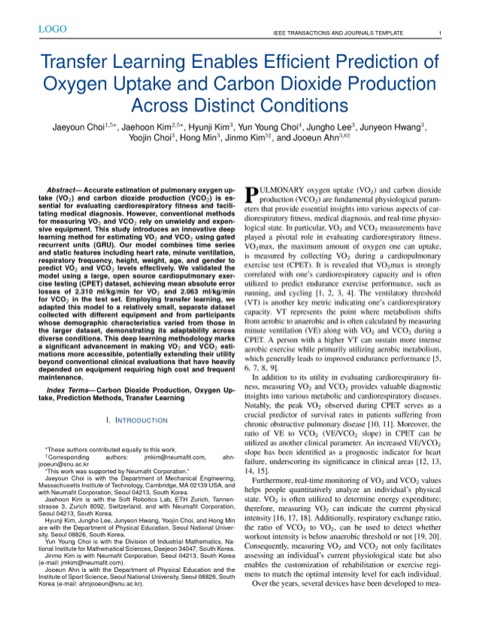
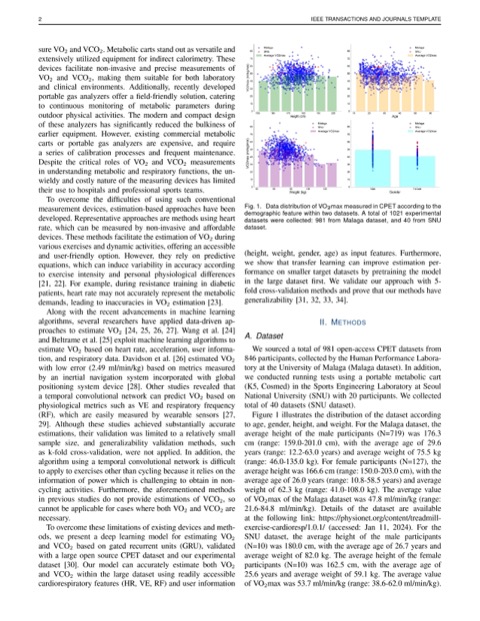
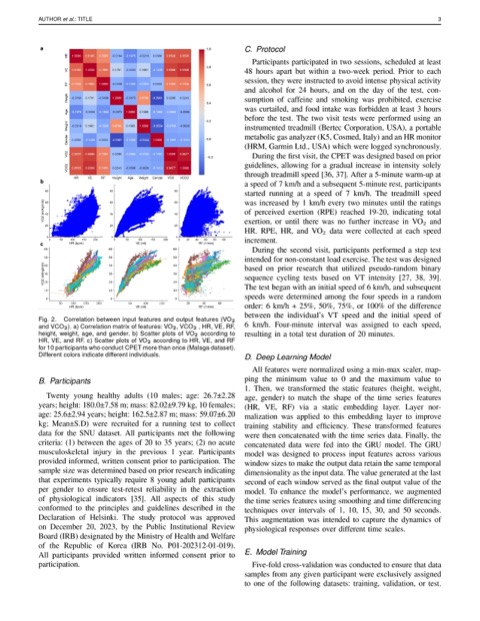
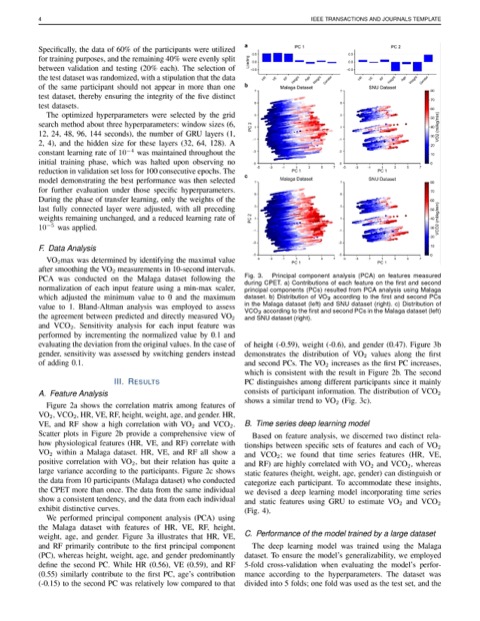
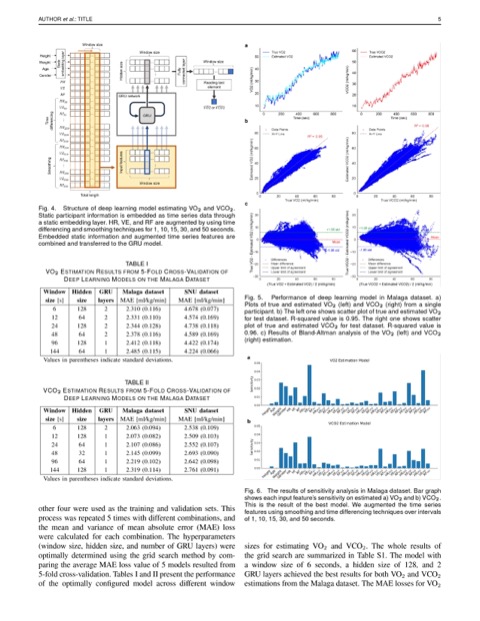

Accuracy validated by SNU research
In clinical research with a Seoul National University team,
neumafit verified 98% analytical agreement with medical-grade equipment.
(Paper: Estimation of Pulmonary Oxygen Uptake (VO2) and Carbon Dioxide Production (VCO2) via Deep Learning based on Transfer Learning)
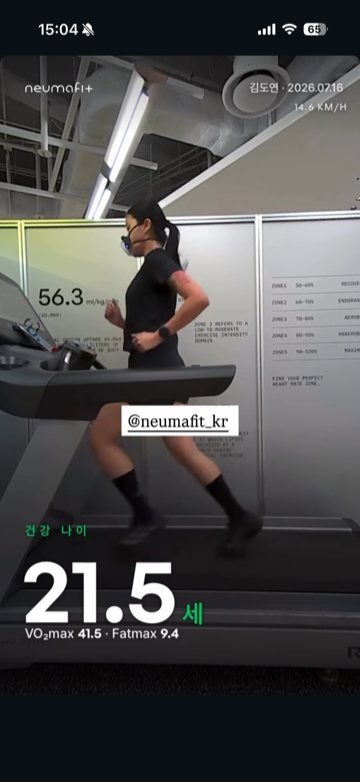
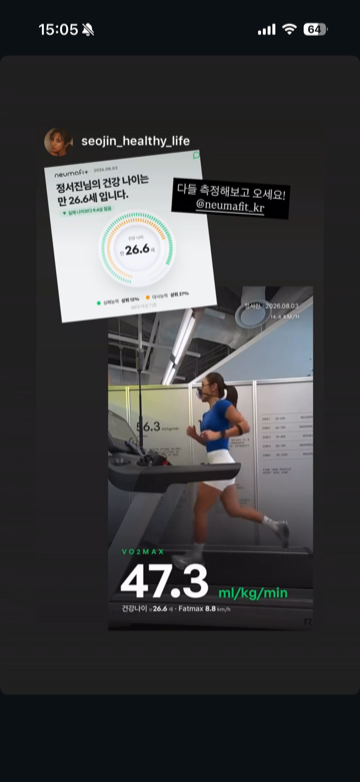



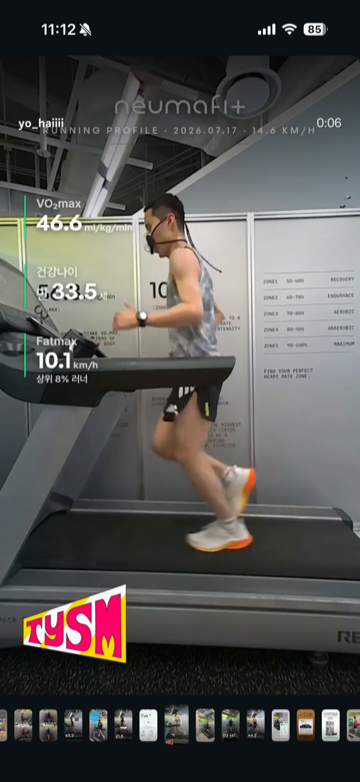



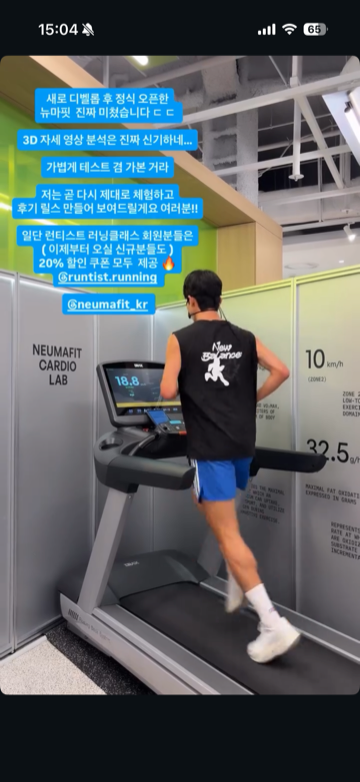

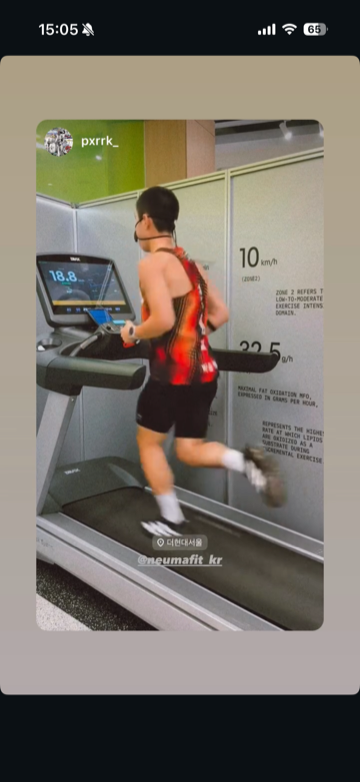
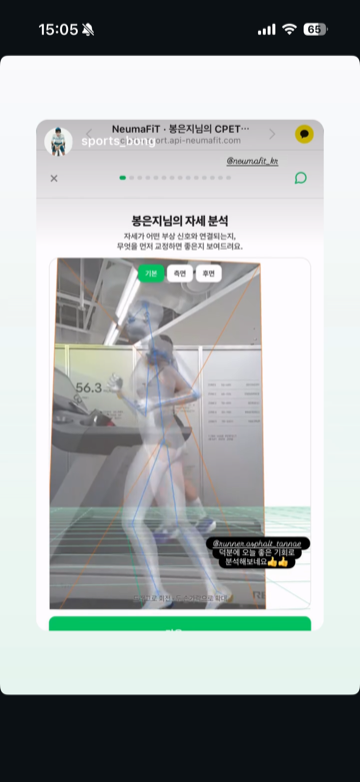
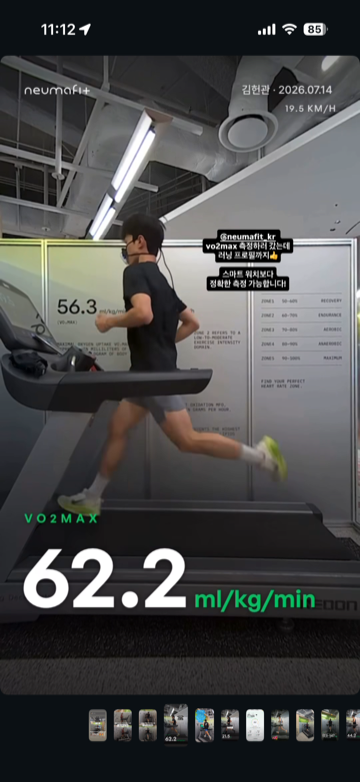
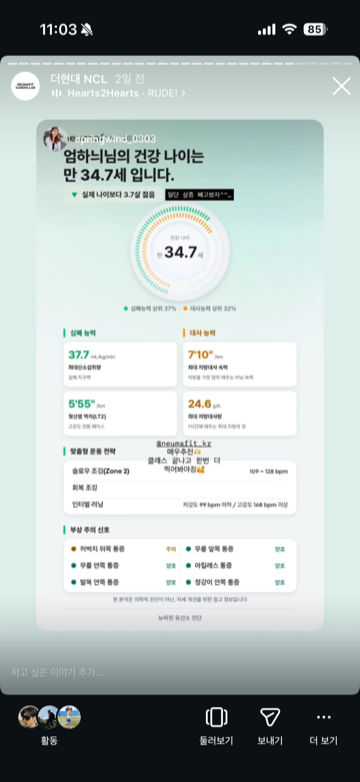
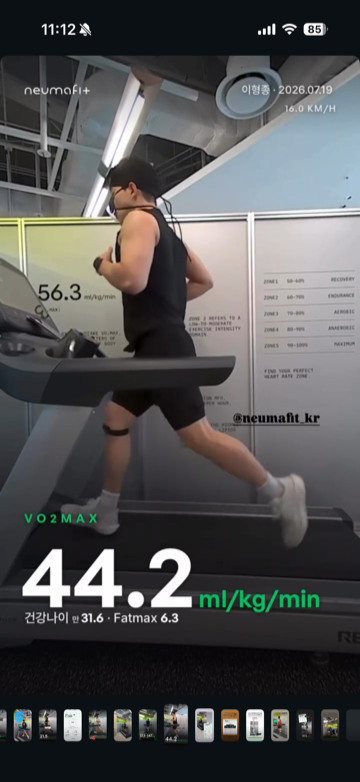
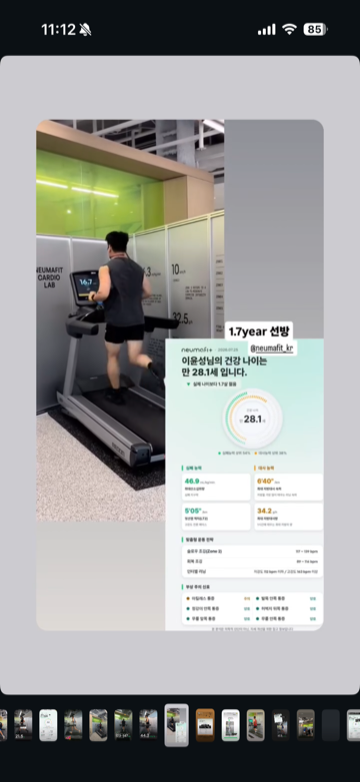


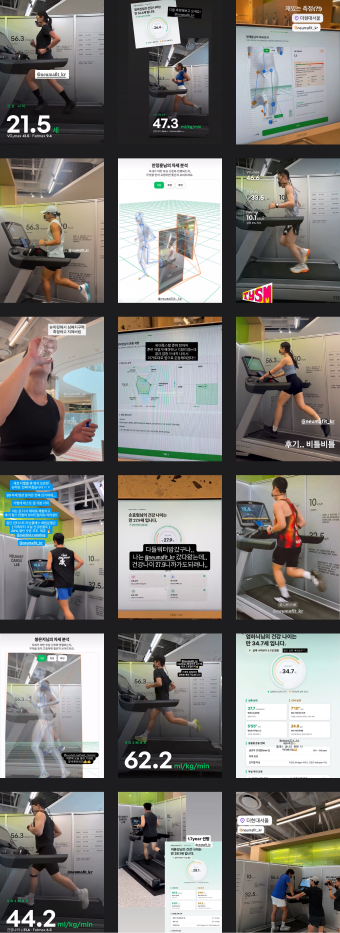
Cumulative tests
Re-test rate
Since launch, neumafit has recorded 50,000 cumulative tests
and a 93% re-test rate, supporting many people's training.



Official partner of USA Triathlon
neumafit is an official partner of USA Triathlon, with globally trusted technology.
*Using the 1st-generation neumafit device















We research together.
neumafit builds its data and validates its
results alongside Korea's research and
medical institutions. Their work sets the
standard our technology is held to.neumafit builds its data and validates its results alongside Korea's research and medical institutions.
Their work sets the standard our technology is held to.

















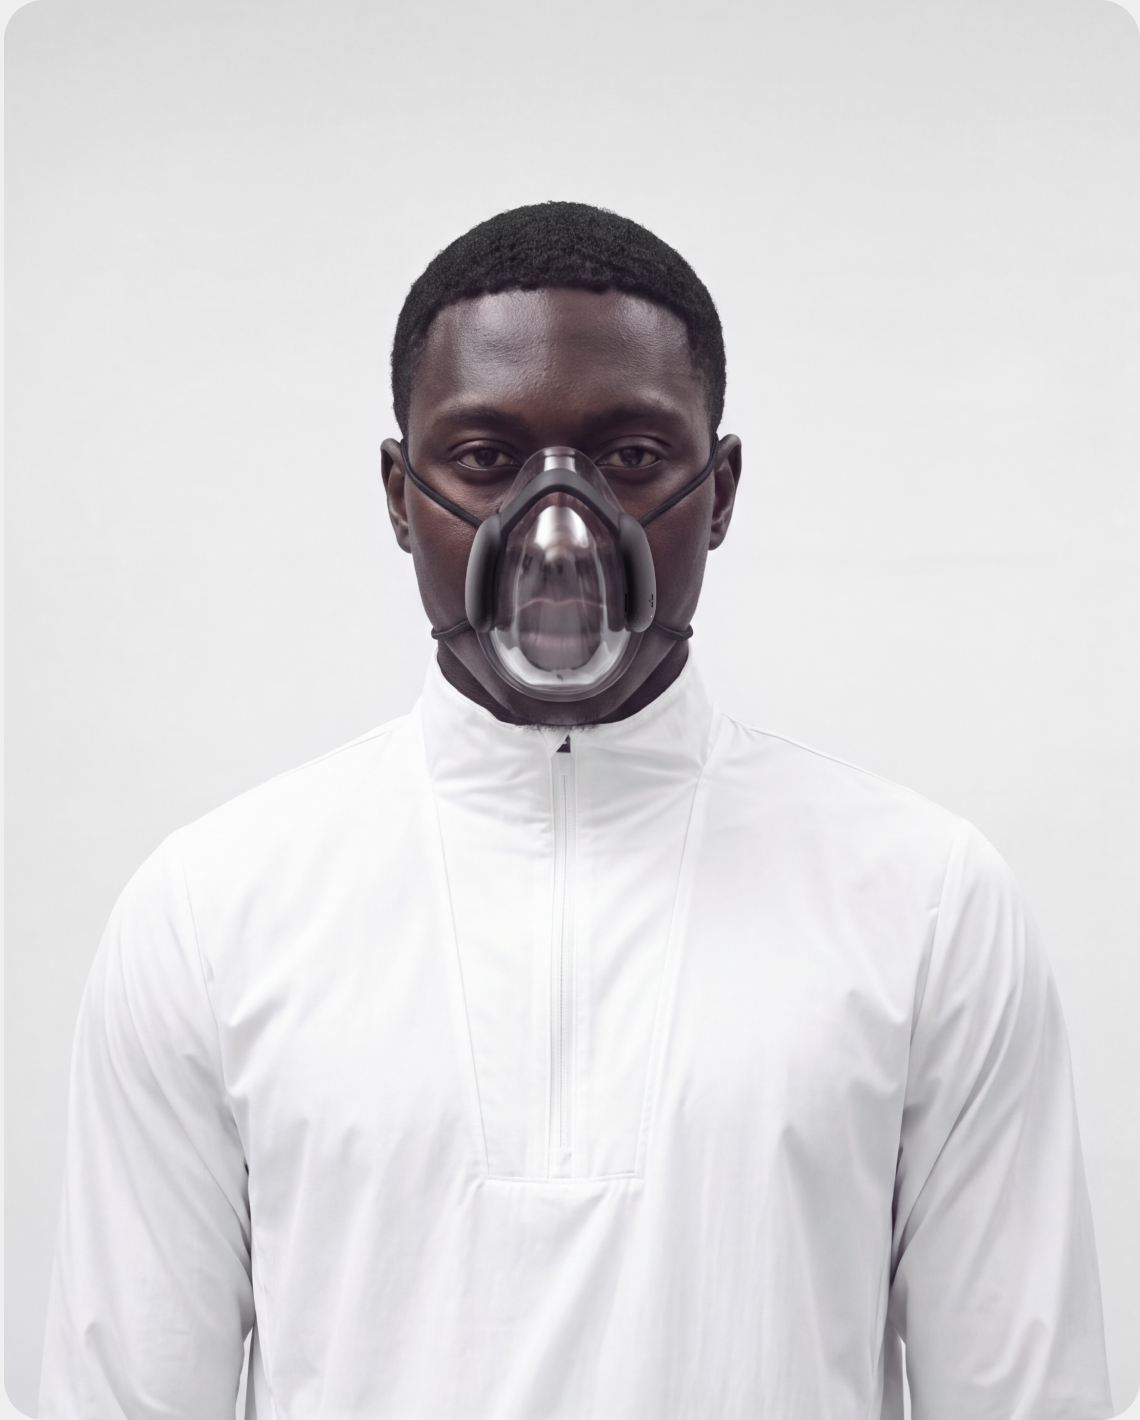
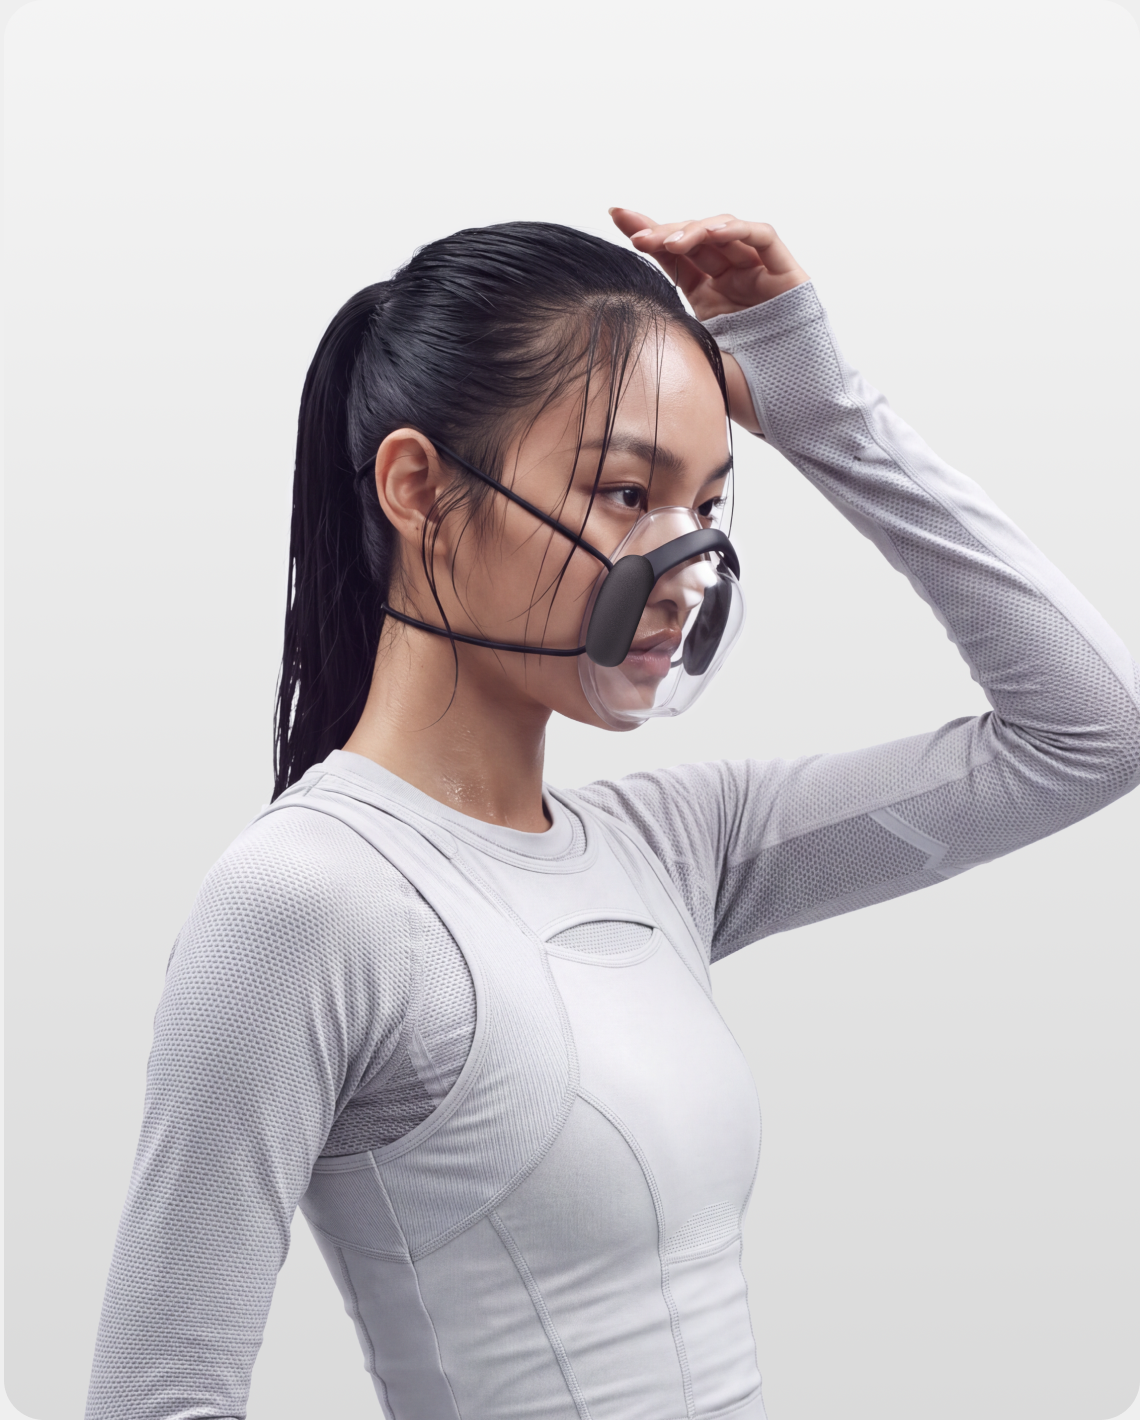
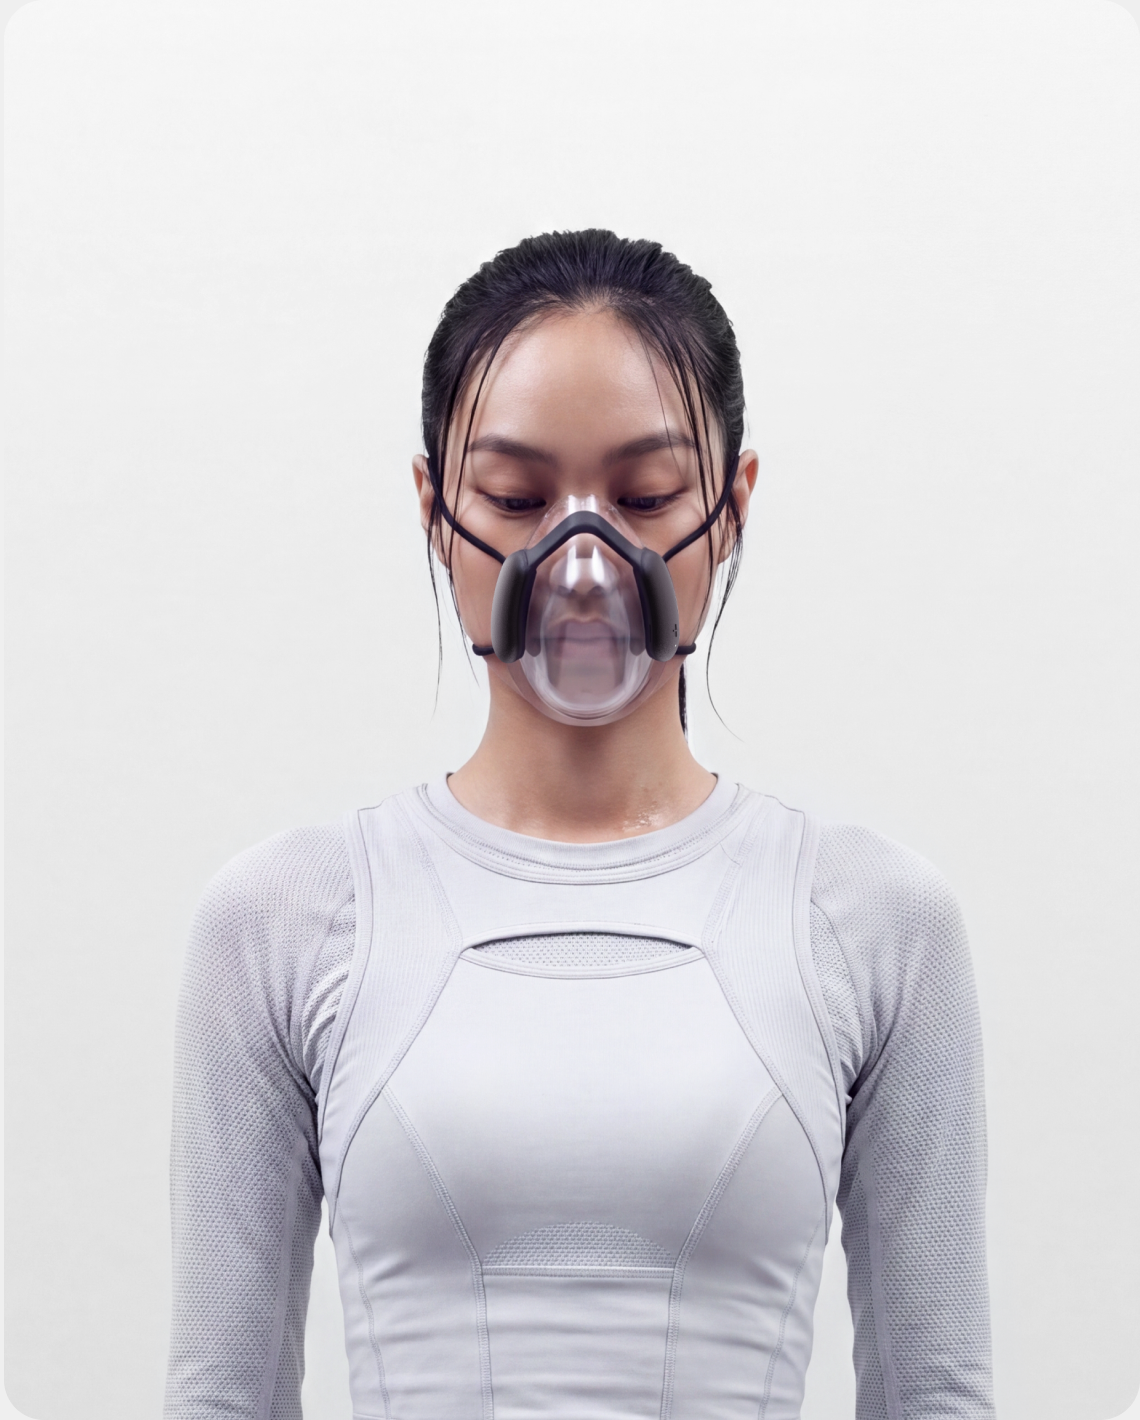
 Device Gen2DEVICE GEN2
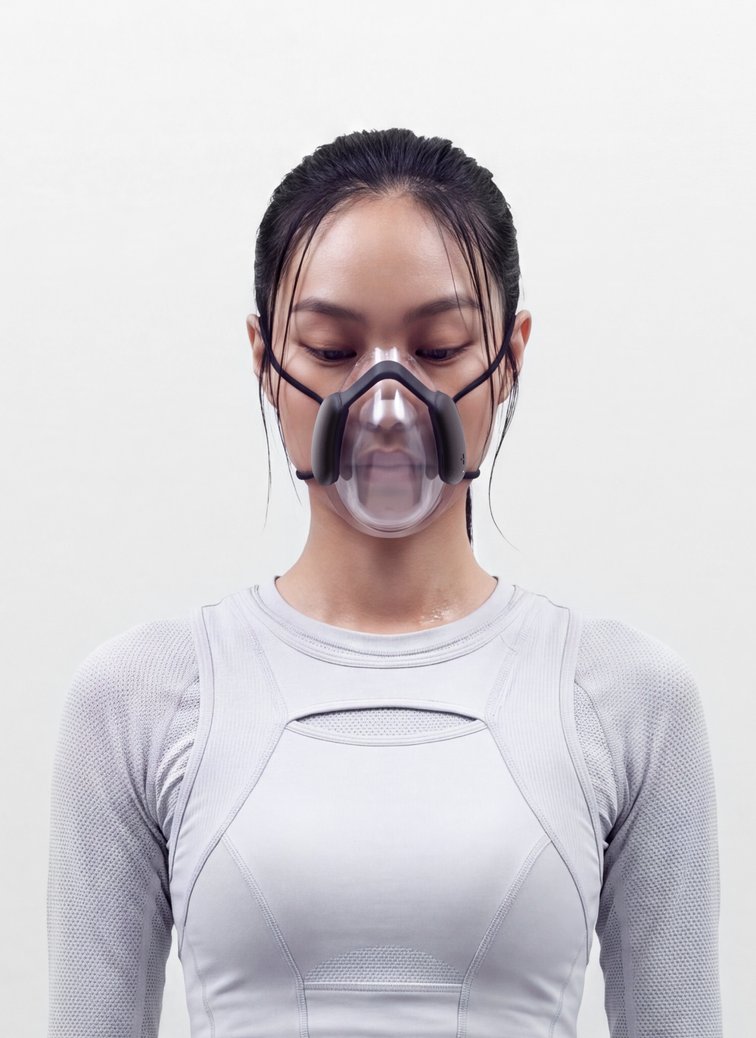
The device behind every measurement — the second-generation neumafit, refined down to the last detail.
Advanced breath analysis reads each user's training data with even greater precision.
Sharper diagnostics, a more comfortable fit. Try it for yourself.The device behind every measurement — the second-generation neumafit, refined down to the last detail. Advanced breath analysis reads each user's training data with even greater precision. Sharper diagnostics, a more comfortable fit. Try it for yourself.
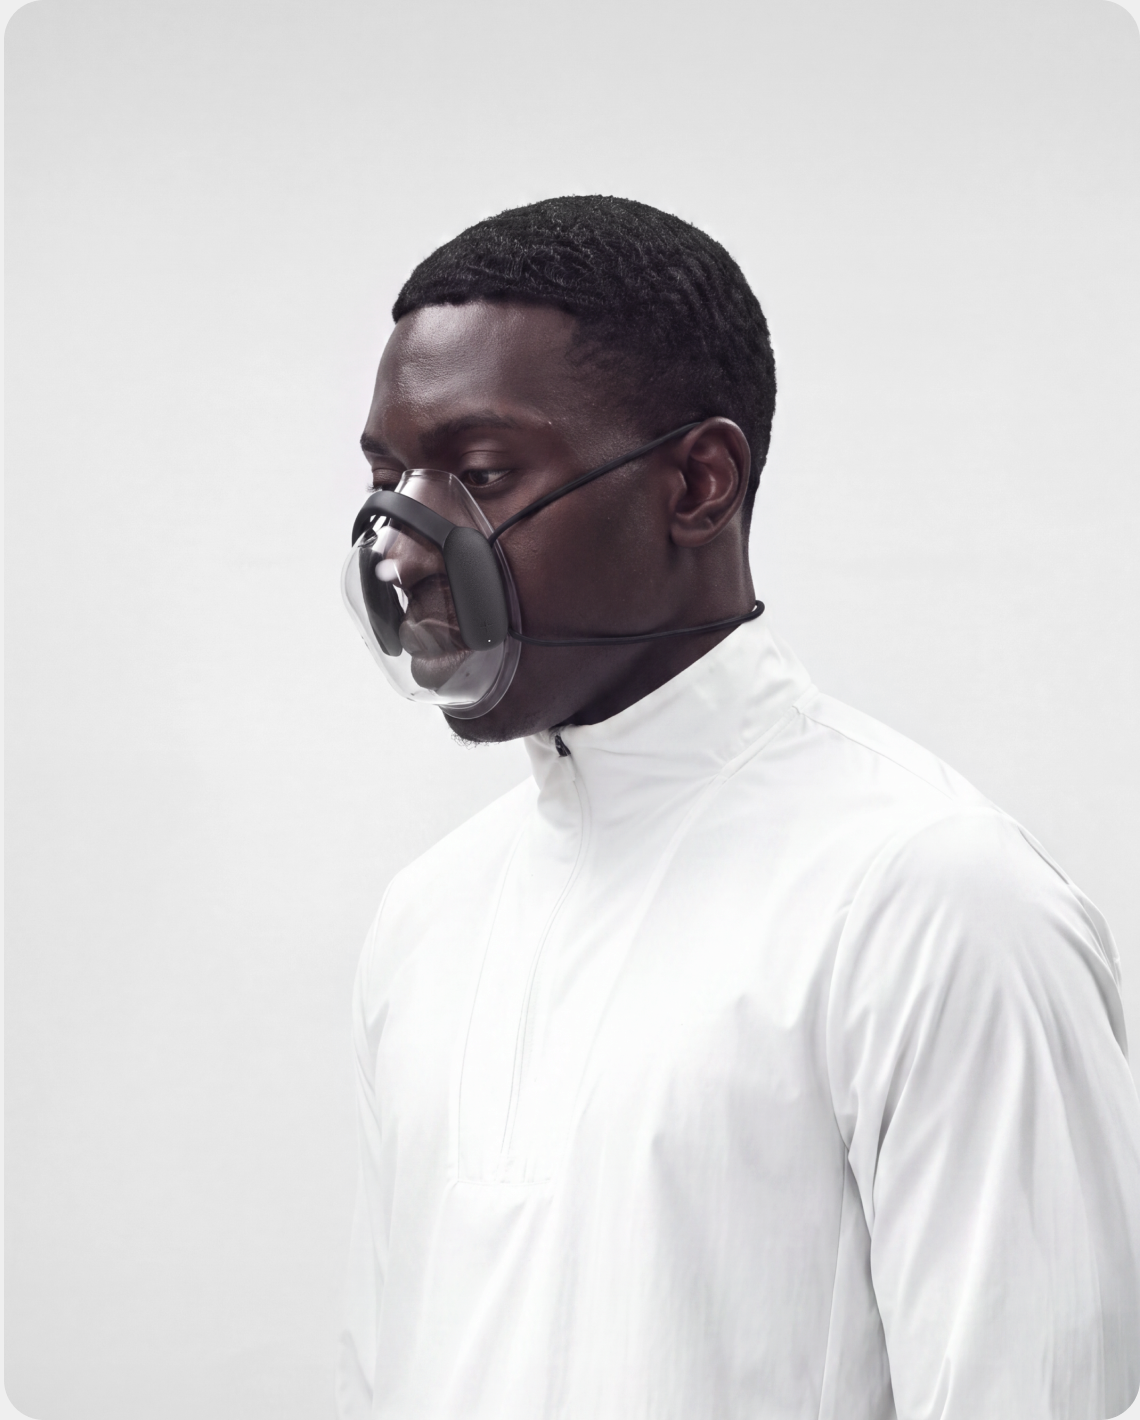
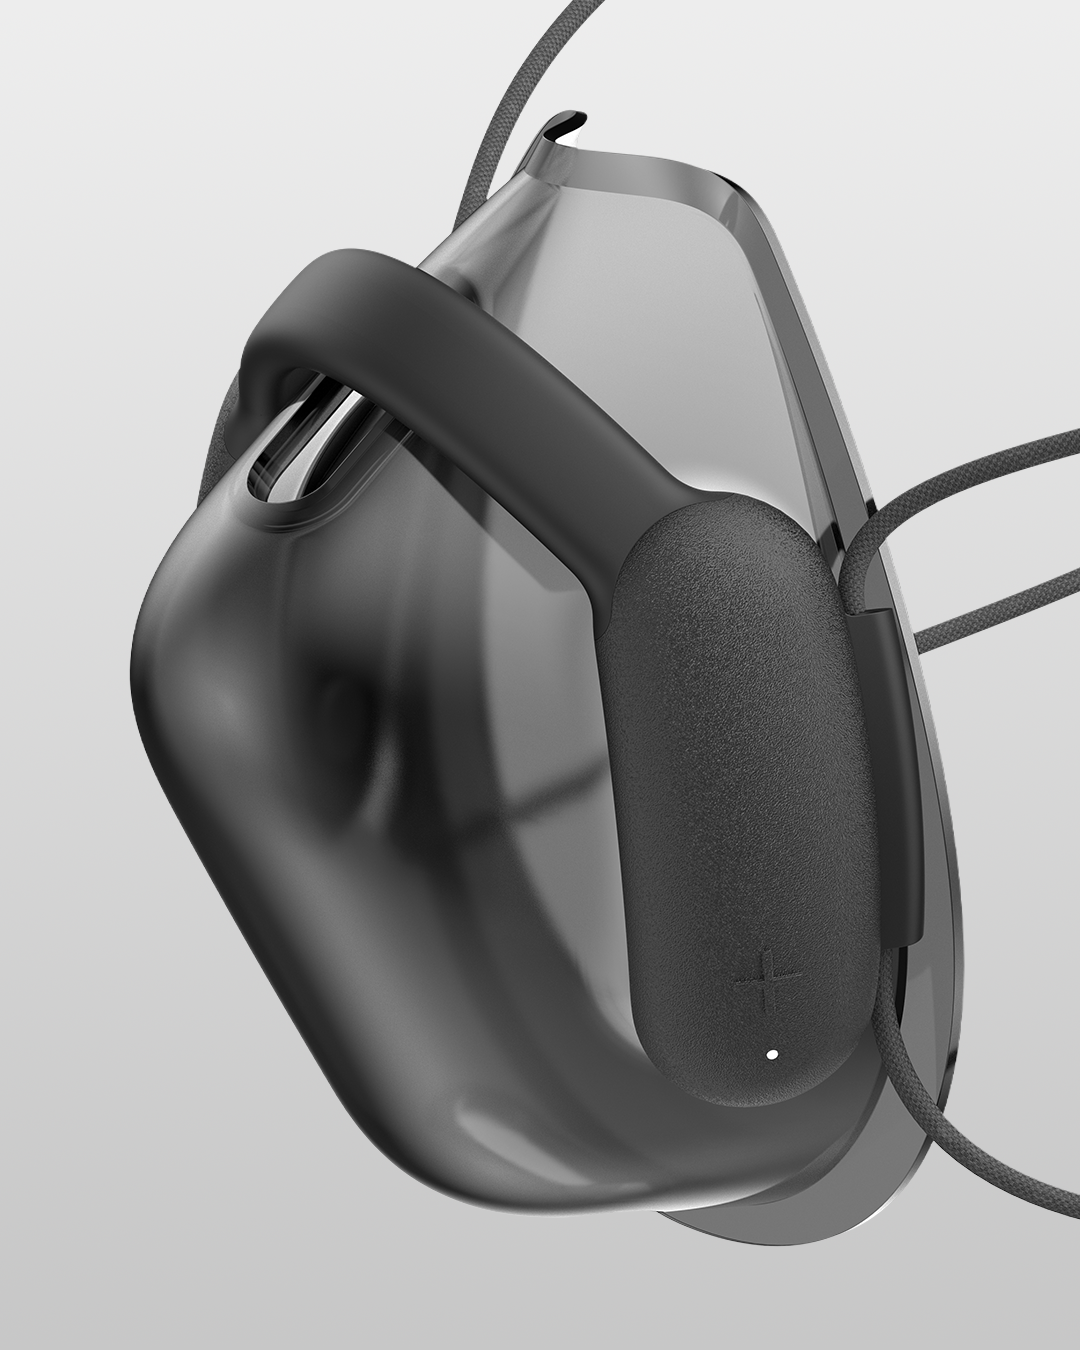
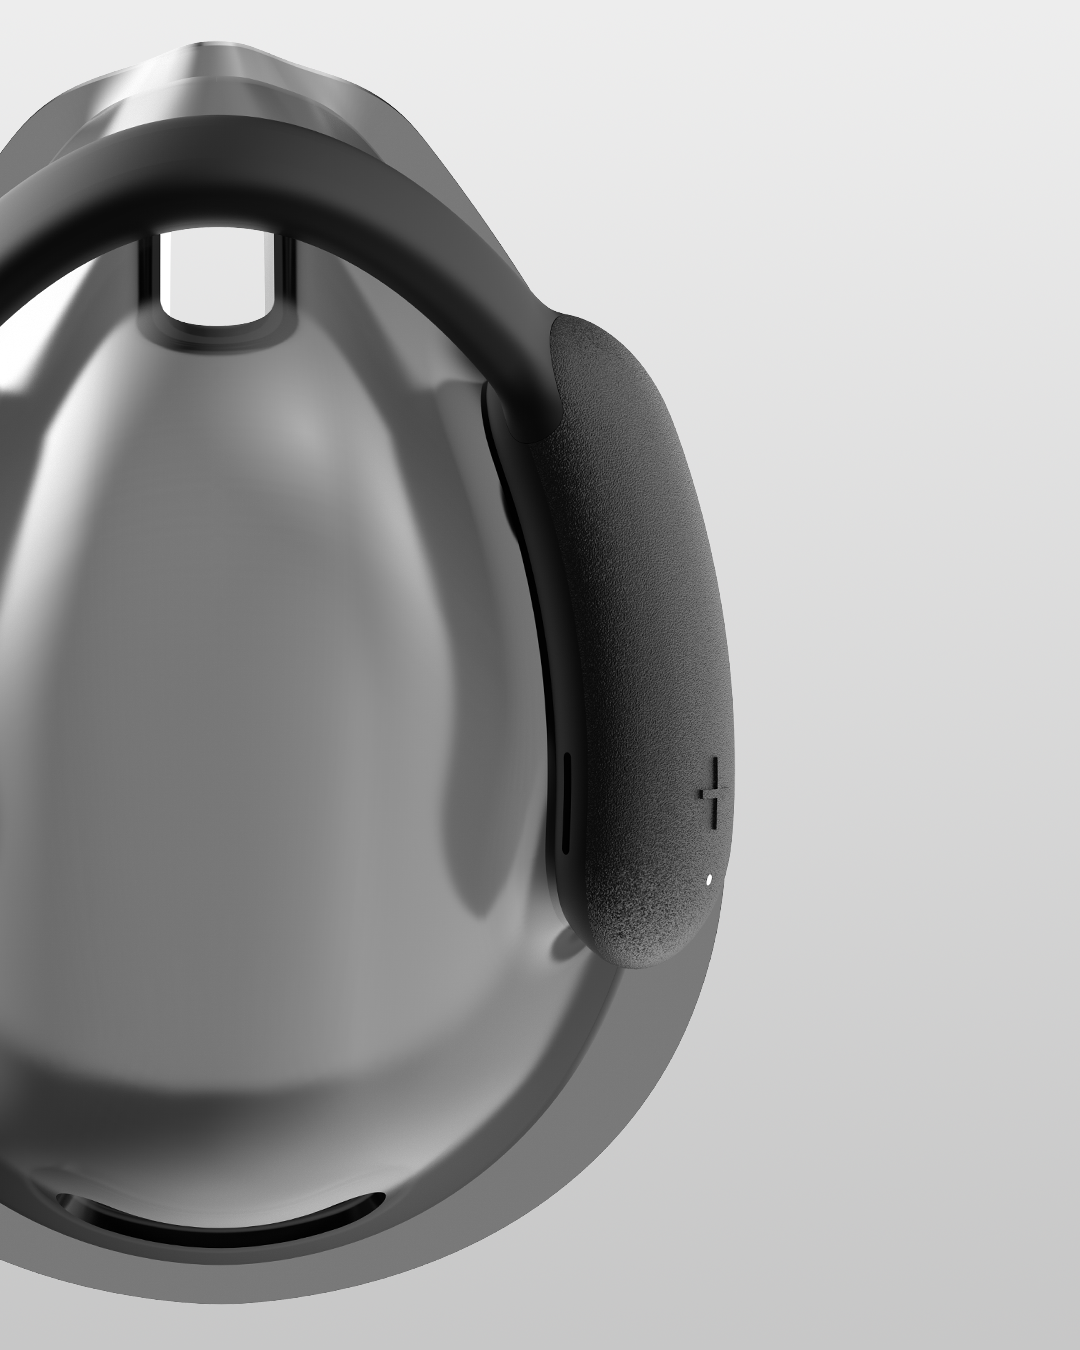
Flow Measurement Channel
Measures breath volume, breathing cycle, pattern and rhythm.
Measurement Mask
Made from medical-grade PVC.
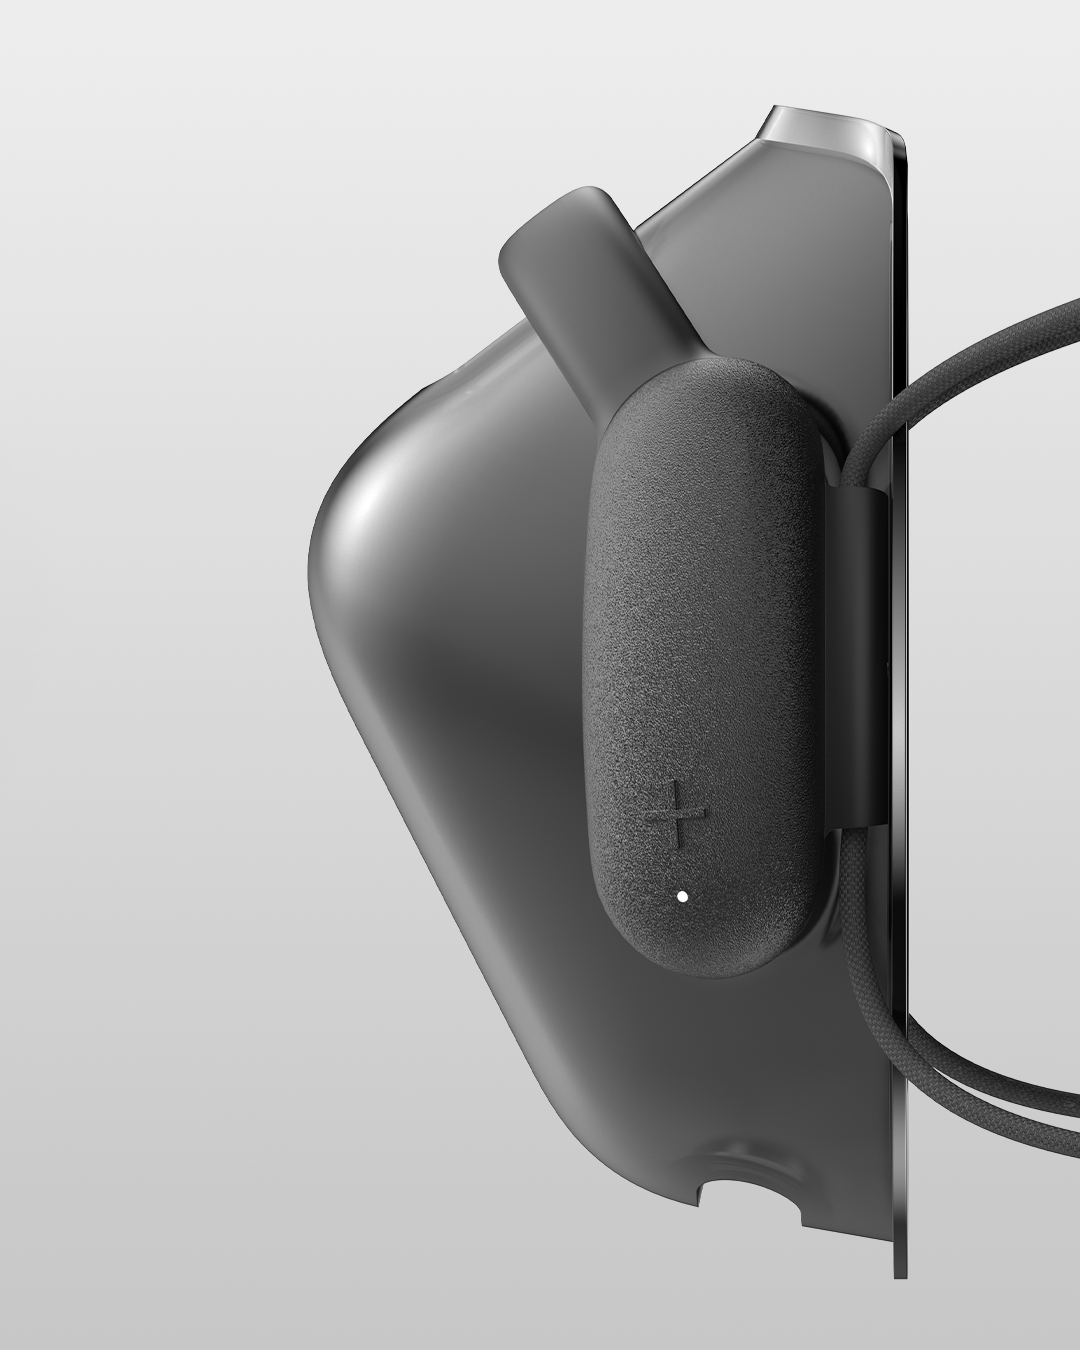
Power sensor
LED
Power indicator
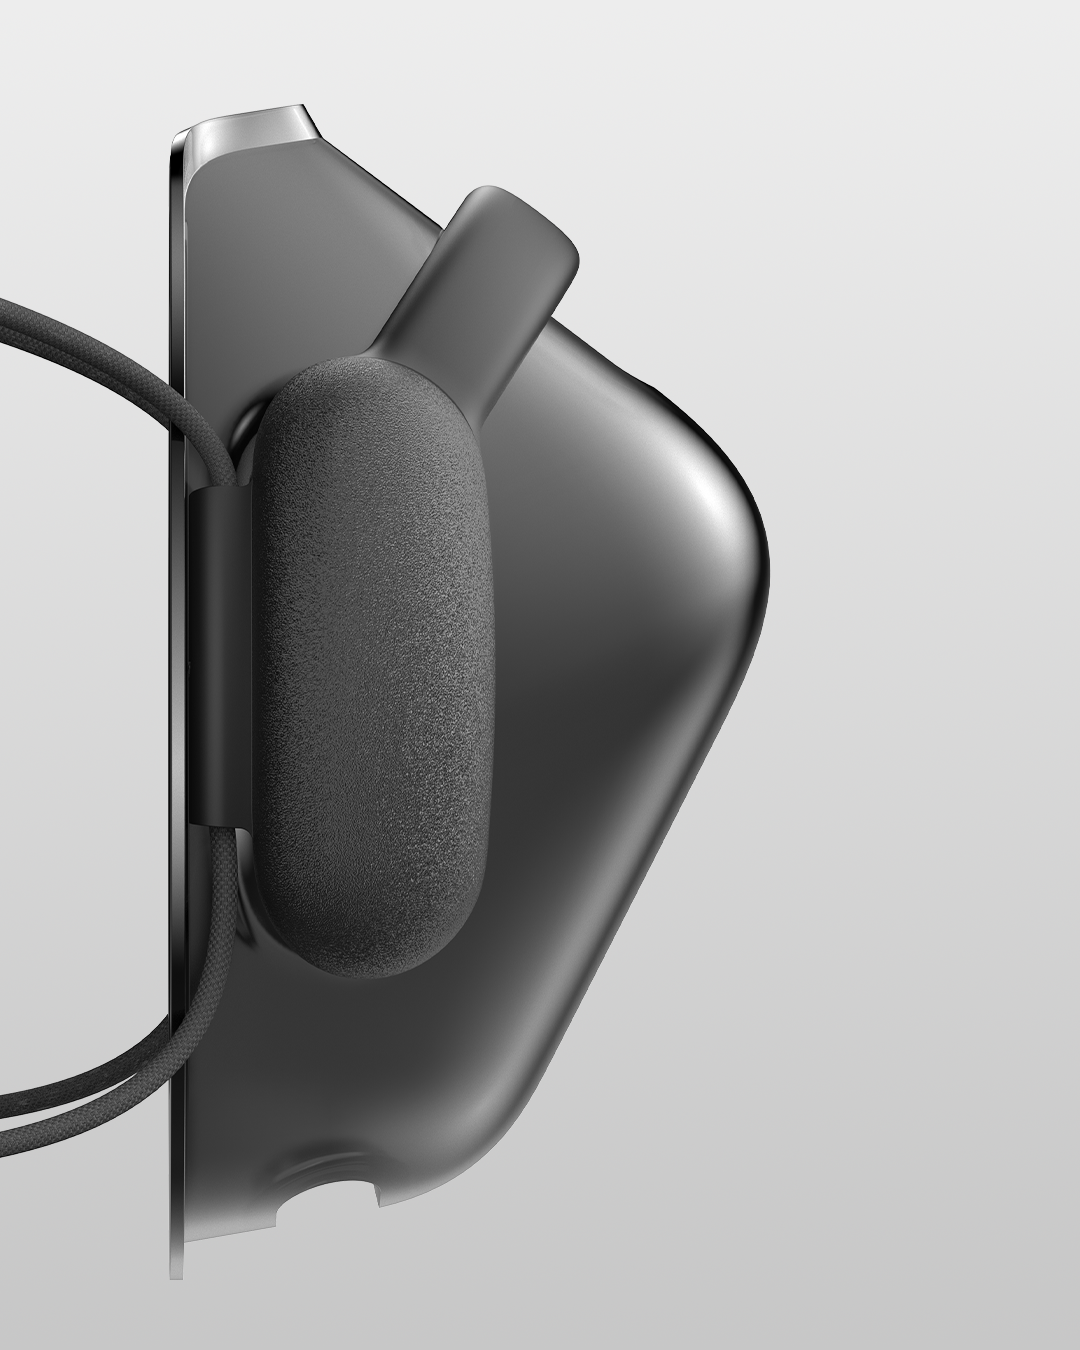
Gas Measurement Chamber
Measures the gas composition of every exhale.


Here's how centers put it to work.
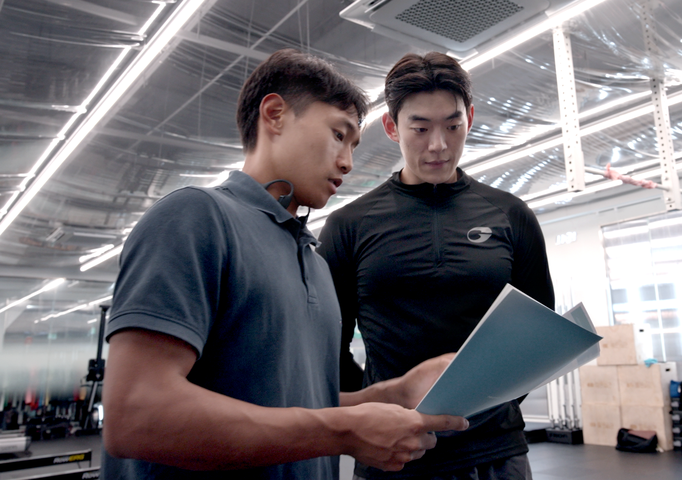
Start every sign-up with a test.
InBody shows composition;
neumafit shows the engine.
Report-based consults are
the natural path to PT.
Here's how centers put it to work.
Start every sign-up with a test.
InBody shows composition;
neumafit shows the engine.
Report-based consults are
the natural path to PT.
Frequently asked questions
The measurement principle is the same. neumafit automates that test into a 10-minute self-guided test with no specialist required, and turns the results into a report and exercise prescription anyone can understand.
A smartwatch estimates VO₂max from heart rate and pace. neumafit measures respiratory gases directly. Estimates can vary widely, whereas direct measurement is the same method used in clinical testing.
When lactate builds up, your breathing pattern changes in a characteristic way. We analyze that change precisely to locate the threshold point without drawing blood — an established method in sports science.
It uses a graded, incremental-load protocol, so the full range of metabolic change from low to maximal intensity is recorded within those 10 minutes.
We compare your measured VO₂max against reference data for the same sex and age group to convert it into the age your cardiorespiratory fitness corresponds to.
Yes. Clients run the test themselves following the system's guidance, and the report is generated automatically. We provide operational training at rollout.
A treadmill and a small amount of space are enough. You can find the equipment makeup and installation details on the rollout page.
The report is the consultation material. You can walk through a client's metabolic curve together to explain "why they should train this way" with data, and the 6–8 week re-measurement becomes a natural return touchpoint.
It runs in four steps: inquiry → detailed guidance → installation and operational training → complimentary ongoing support.